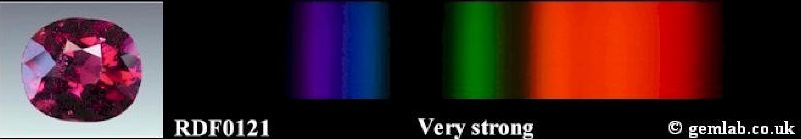
Almandine Garnet Absorption Spectrum (image courtesy of John S. Harris)
© Kirk Feral 2009-present, All Rights Reserved. These materials may be duplicated for educational purposes only. No part of this website may be duplicated or distributed for profit, for commercial purposes, or for posting to another website without the expressed written consent of the copyright holder.
Spectroscopy in Relation to Magnetism
Spectroscopy and magnetic testing are closely related methods of gem identification. Hand-held spectroscopes detect the presence of transition metals and rare earth metals that cause color in gemstones. Magnets detect the same metals. The positioning of the black absorption bands and lines along the light spectrum that we see with a spectroscope provide clues about which particular metals are present within a gem.
In many cases, gems that show strong absorption patterns also show a strong magnetic attraction. As you might expect, gemstones that show no visible absorption pattern also tend to show little or no attraction to a magnet. The strong absorption spectrum shown below is due to high iron content in Almandine Garnet.
When detecting low concentrations of metals that are strong chromophores such as chromium (Cr3+) and cobalt (Co2+), a spectroscope is more sensitive than a magnetic wand. But a magnet allows us to detect weak chromophores such as iron (Fe3+) and manganese (Mn2+) at lower concentrations than we can detect with a spectroscope. In the absence of a magnetic wand, more sophisticated instrumentation such as a spectrometer are required to detect low levels of iron and manganese within a gem. You can find more information about spectroscopy in the book A Student's Guide to Spectroscopy by Colin Winter (2003) OPLspectra.com, The Spectroscope and Gemmology by Basil Anderson, and at John Harris' gem spectroscopy website gemlab.co.uk.
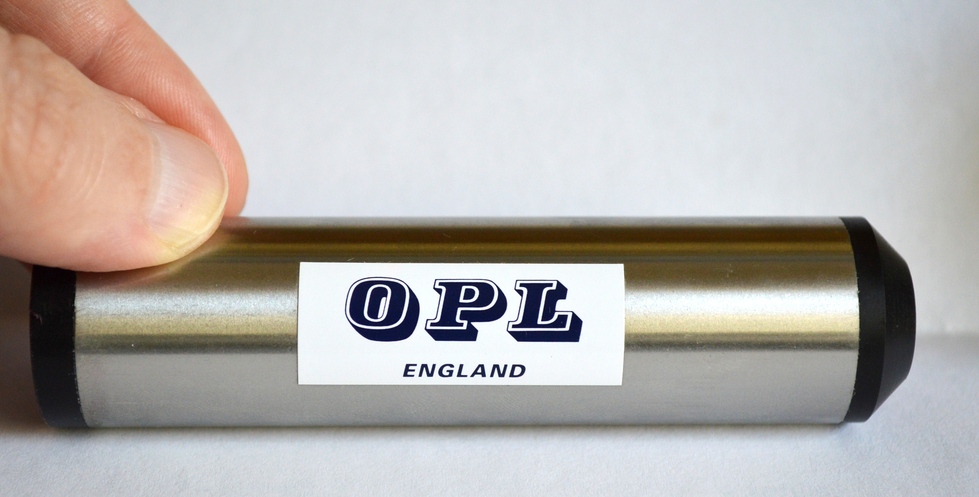
Hand-held OPL Teaching Spectroscope
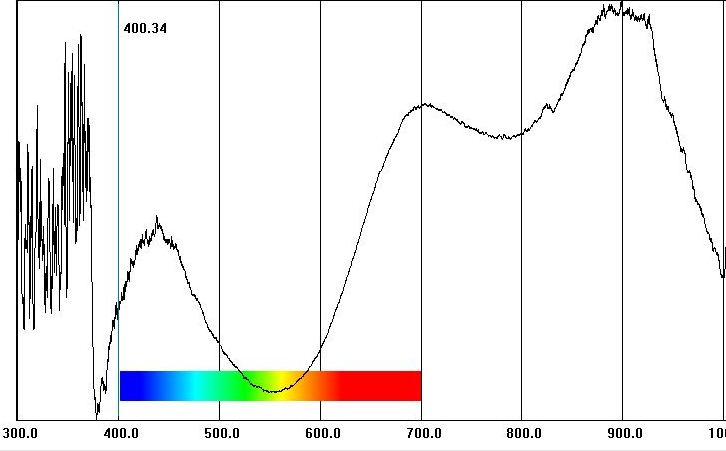
In our lab, a UV-Vis-NIR spectrometer (Ultraviolet, Visible spectrum, and Near-Infrared) helps us identify specifically which metals within a gem are responsible for the color and/or magnetism. Manganese and copper are clearly indicated in the graph below for green Paraiba Tourmaline. When we look at an absorption spectrum represented as a spectrometer graph like the one below, we can see that the peaks on the graph correspond to the black lines and bands seen with a spectroscope. These peaks represent the wavelengths or areas of the light spectrum that are absorbed by specific metal ions. Gems that do not contain paramagnetic metals show no peaks.
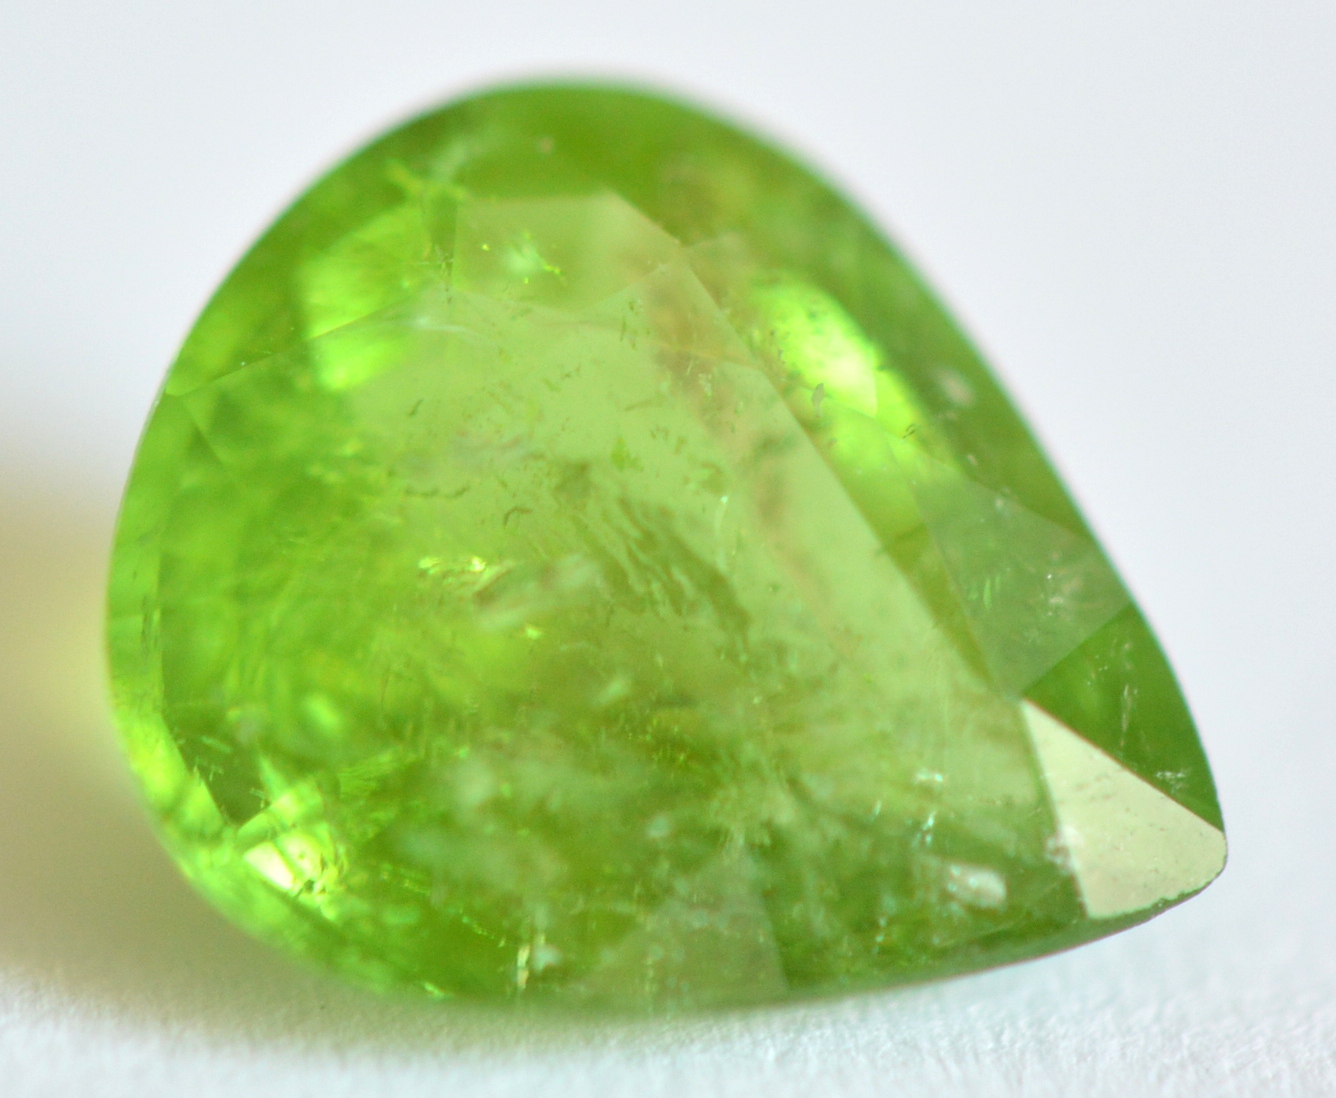
Green Paraiba Tourmaline (Mozambique)
Multiple Chromophores
Often there are two or more metallic chromophores mixed within a single gem, but a magnet cannot be used to distinguish between them. Magnetic susceptibility only reflects the collective magnetism of all the metal ions within the gem. A hand-held spectroscope can help us identify the specific metals that are present. Better still is a spectrometer, a more sensitive instrument that permits a more detailed analysis of the metallic components, their relative concentrations and even their valence states.
An example of a gem containing multiple chromophores is the green Paraiba Tourmaline from Mozambique shown below, which contains both copper and manganese impurities. The green color of this copper-bearing gem is due to copper ions (Cu2+, blue color) mixing with manganese ions (Mn2+, yellow color) to create green color (blue + yellow = green).
There is much to learn through the study of gemstone paramagnetism in relation to spectroscopy, but this is an area of gemological research that has yet to be pursued by gemologists. You can find an online spectroscopy database showing absorption graphs for many gems at Dr. George Rossman's Spectroscopy Database for Minerals.
Absorption Spectrum Showing Manganese and Copper in a Green Paraiba Tourmaline
Copper (Cu2+)
Manganese (Mn2+)

This green Paraiba Tourmaline shows a very strong magnetic response. Is this strong paramagnetism due to copper ions or manganese ions, or a combination of the two? The answer is not obvious without some prior knowledge about magnetism in gemstones. Copper (II) oxides (CuO) are weakly paramagnetic and found only in low concentrations in Paraiba Tourmalines. Concentrations are almost certainly too low to be magnetically detectable. Manganese (II) oxides (MnO) are also in low concentrations, but these oxides are strongly paramagnetic. We can conclude that the strong magnetic susceptibility shown by our green copper-bearing gem is likely due entirely to manganese.
Magnetism in Gemstones
An Effective Tool and Method for Gem Identification
© Kirk Feral